


History Says These 3 Warning Signs Precede Major Stock Market Crashes. All 3 Are Flashing Red Right Now.
History Says These 3 Warning Signs Precede Major Stock Market Crashes. All 3 Are Flashing Red Right Now.

John Bromels, The Motley FoolWed, August 12, 2026 at 5:05 PM UTC
0

Key Points -
Certain signs have preceded the worst stock market crashes in history.
The market is currently richly valued, according to the Buffett indicator.
The Shiller CAPE ratio is elevated to levels that have indicated prior bubbles.
10 stocks we like better than S&P 500 Index ›
&&
The stock market has been on a winning streak for almost four straight years. The S&P 500 hit a low of 3,577 on Oct. 12, 2022. Since then, it's more than doubled to around 7,750 today. The tech-heavy Nasdaq Composite has performed even better, up 155% during the same time period.
But all bull markets come to an end eventually. In fact, three of the most ominous warning signs that preceded the biggest market crashes in history have been flashing red for months. Here's why history says a market crash might be in store for us, and how investors should react.
Missed Nvidia in 2009? This Rare Signal Is Flashing Again.In 2009, a "Double Down" signal flashed for a little-known chipmaker called Nvidia. For the first time in years, that same "Total Conviction" signal is flashing for a company 1/100th the size of Nvidia. Continue »
&&
Image source: Getty Images.
1. Sky-high valuations
Three of the biggest market crashes in history -- the 1929 crash that started the Great Depression, the early 2000s dot-com crash, and the Great Recession crash of 2008-2009 -- were preceded by skyrocketing market valuations. When those valuations were suddenly exposed as unsustainable, the market tumbled.
One easy way to measure the valuation of the market as a whole is to use the so-called "Buffett indicator," named after legendary investor Warren Buffett of Berkshire Hathaway. This is the ratio of the total U.S. stock market value to gross domestic product (GDP), and Buffett himself once called it "the best single measure of where valuations stand at any given moment."
The Buffett indicator has only been above 100% three times in recent history: It reached almost 150% in 2000, right before the dot-com crash, and it went above 100% right before the Great Recession.
The third time? Right now. The Buffett indicator currently sits above 200%, indicating that the stock market as a whole is severely overvalued.
2. High debt levels
Just before the 1929 crash, the number of stocks purchased on margin -- that is, with borrowed money -- rose to an all-time high.
Before the Great Recession, consumer debt levels soared as real estate investors took out subprime mortgages on houses they intended to "flip" for a quick profit. The nation's total household debt level in the third quarter of 2008 -- right before the stock-market crash -- had hit a record $12.7 trillion. When the housing market collapsed, borrowers couldn't repay their loans, resulting in an economic catastrophe.
In the first quarter of this year (the most recent quarter for which data is available), household debt hit a record $18.8 trillion. Meanwhile, the private credit industry is also facing rising defaults.
3. A bursting bubble
In all three historical cases, the actual catalyst for the stock-market crash was the bursting of a bubble. In 2008, it was the housing bubble; in 2000, it was the dot-com bubble; in 1929, rampant speculation and margin buying had essentially turned the entire stock market into a bubble. Of course, the thing about a market bubble is that you don't find out it's a bubble until it pops.
Advertisement
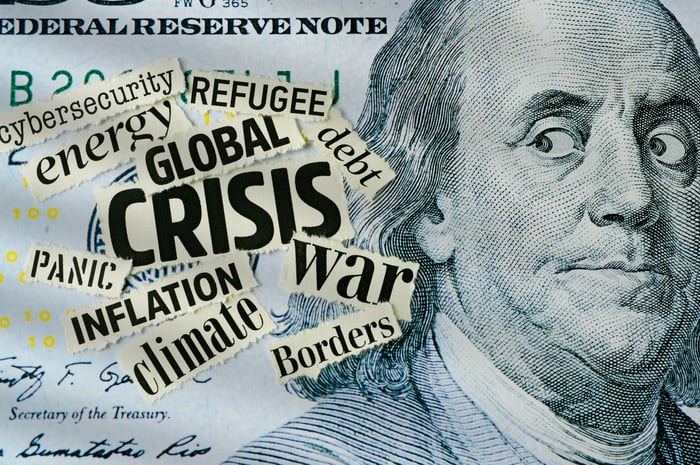
Image source: Getty Images.
Currently, there's a lot of concern that the high level of artificial intelligence (AI) spending driving the market to new heights is a bubble about to burst. Indeed, the Shiller CAPE (cyclically adjusted price-to-earnings) ratio, which measures the valuation of the S&P 500, has risen above 30, which it has only done twice before; once was just before the stock market crash in 1929, and the other was just before the bursting of the dot-com bubble in the late 1990s. It's currently at 41, the second-highest valuation on record.
What should investors do?
When so many warning signs are flashing bright red, it's tempting to pull all your money out of the market and hide it under your mattress. But history shows that investors who keep their money in the stock market during a recession fare much better.
That's because in most cases, according to research by The Motley Fool, the stock market at least partially recovers before the recession ends. So investors who wait for the economy to improve miss out on some of those gains.
Even if they know the warning signs, nobody can predict exactly when a crash will occur. For example, many people were convinced that a major crash would occur in 2020 due to the COVID-19 pandemic. But while stocks did drop by about 28% in the short term, they rebounded within three months and rose an additional 52% by the end of 2021. Investors who sold at the onset of the pandemic missed out.
While you should be aware of short-term warning signs of a crash, it is usually wiser to stay in the market to maximize your odds of achieving the best long-term financial returns.
Should you buy stock in S&P 500 Index right now?
Before you buy stock in S&P 500 Index, consider this:
The Motley Fool Stock Advisor analyst team just identified what they believe are the 10 best stocks for investors to buy now… and S&P 500 Index wasn’t one of them. The 10 stocks that made the cut could produce monster returns in the coming years.
Consider when Netflix made this list on December 17, 2004... if you invested $1,000 at the time of our recommendation, you’d have $403,337!* Or when Nvidia made this list on April 15, 2005... if you invested $1,000 at the time of our recommendation, you’d have $1,334,946!*
Now, it’s worth noting Stock Advisor’s total average return is 958% — a market-crushing outperformance compared to 214% for the S&P 500. Don't miss the latest top 10 list, available with Stock Advisor, and join an investing community built by individual investors for individual investors.
See the 10 stocks »
*Stock Advisor returns as of August 12, 2026.
&&
John Bromels has positions in Berkshire Hathaway. The Motley Fool has positions in and recommends Berkshire Hathaway. The Motley Fool has a disclosure policy.
Source: “AOL Money”
